DAX (Data Analysis EXpressions) is fundamental to Power BI. And whilst it is possible to use Power BI without knowing how to write DAX, much of the magic of Power BI will be lost to you. Learning how to write DAX is the best move you can make in order to start making the most of Power BI.
But, like all languages, it takes time to master the art of DAX, so the key is to start off small and build up from there. And practice, practice, practice!
With that in mind, one of the first things you’ll probably want tot do is total up some measures in your data – this could be total sales, total cost or some other similar measures. The simplest way to do this is to use the Sum function.
Sum is an aggregator function that sums (or adds up) the contents of a single column and is dependent on the current filter context for determining which values to include.
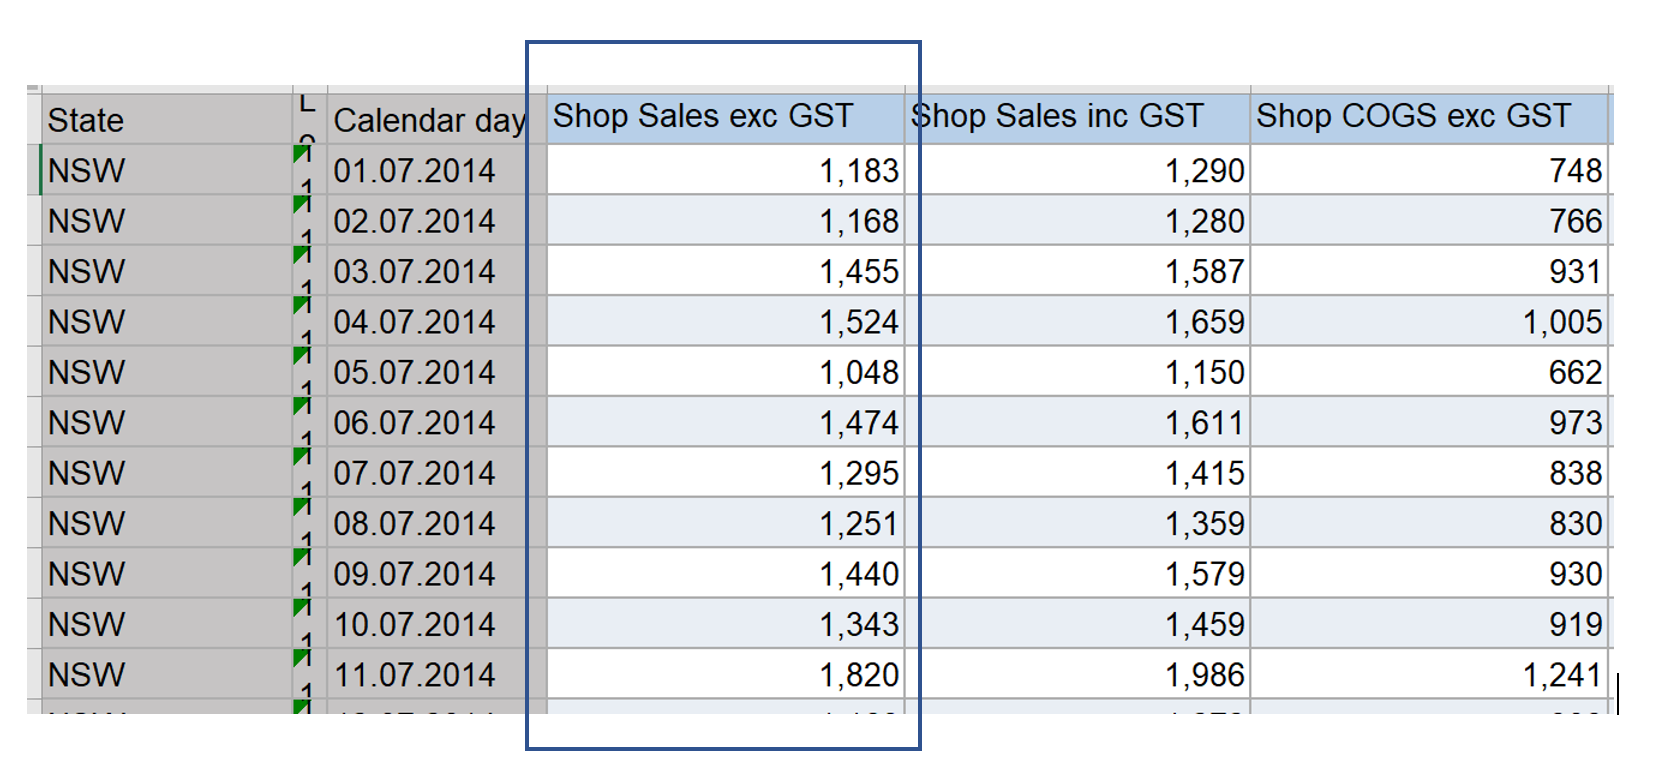
Let’s say you have a sales file, tblSalesData, containing daily sales data covering a period of time across multiple stores. The file contains columns holding the total shop sales before tax, total shop sales including tax and the total Cost of Goods Sold (COGS) value of the transaction:
To get the total sales value of all Shop Sales exc GST, create a DAX measure:
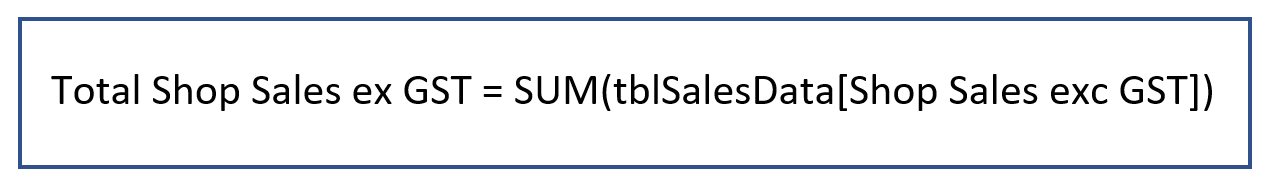
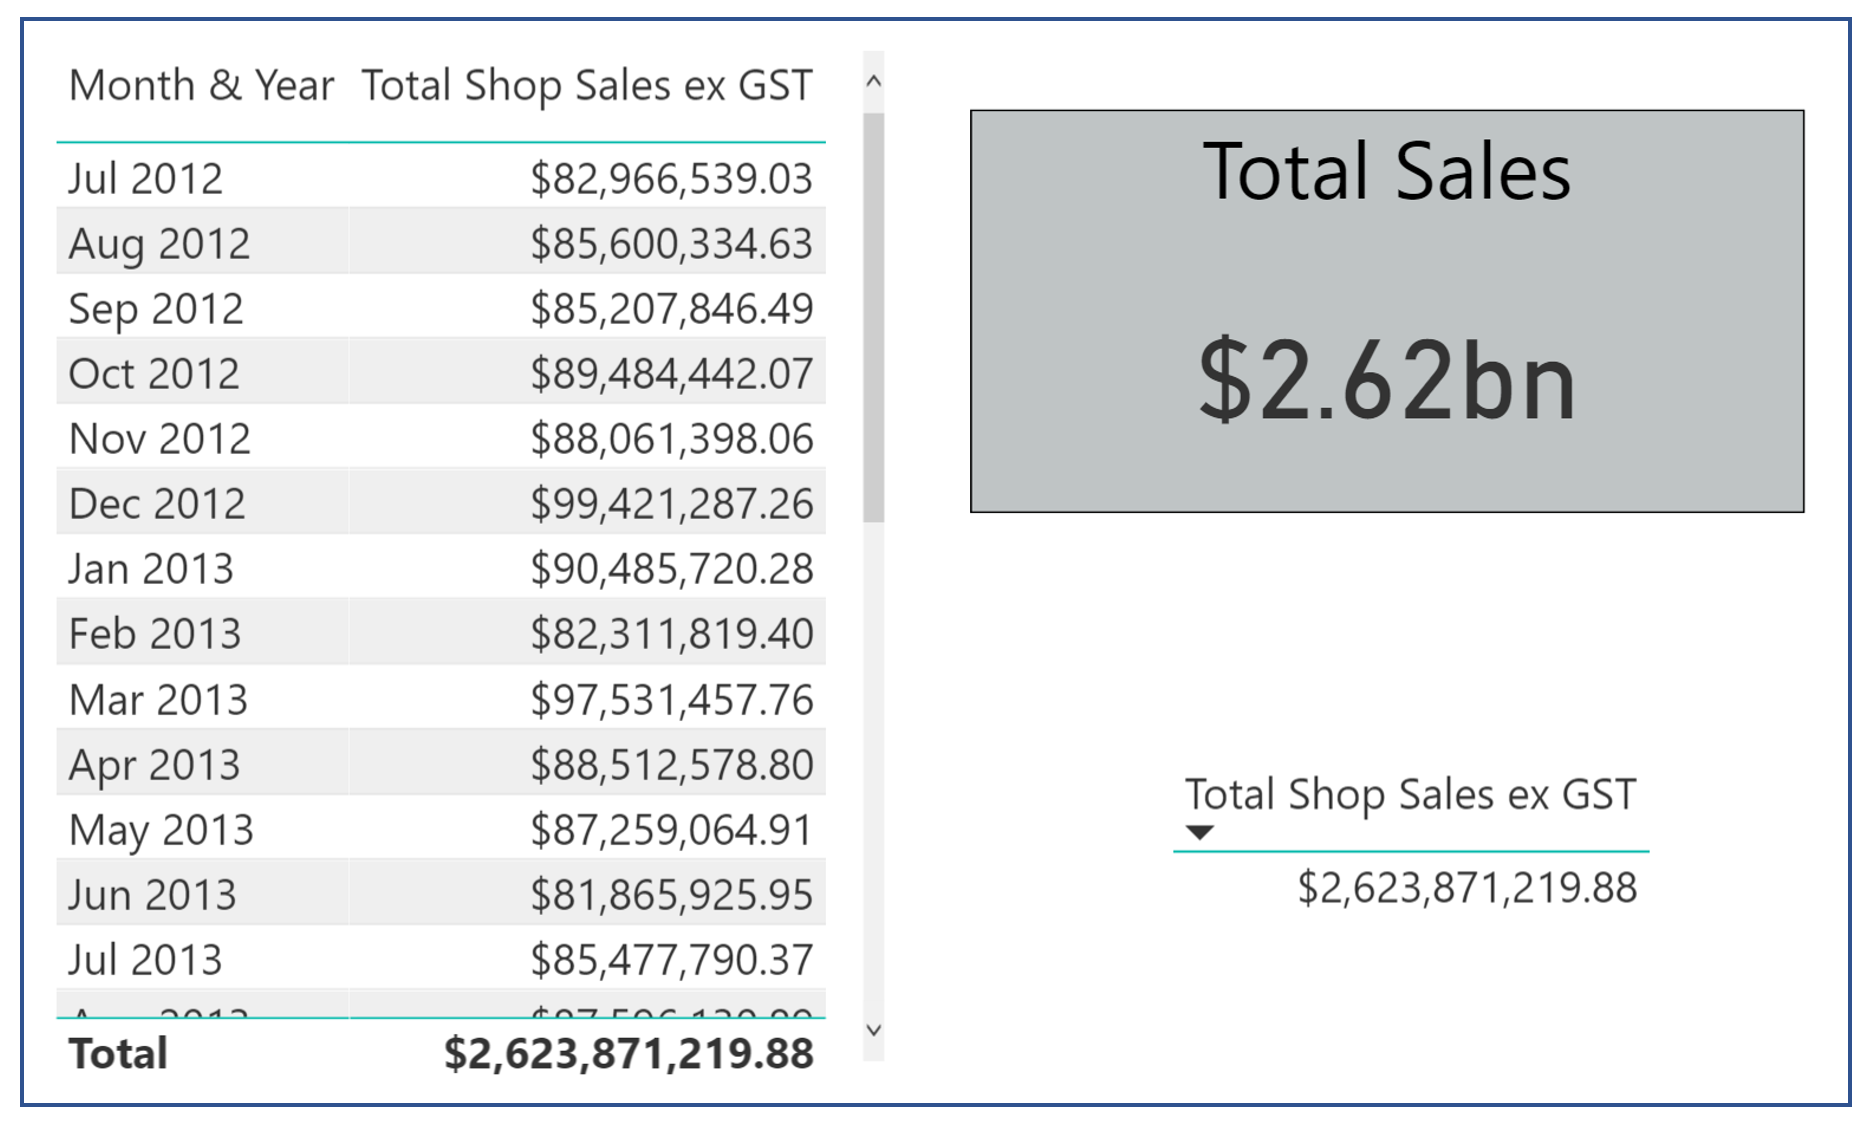
That’s all there is to it. This measure, Total Shop Sales ex GST, can now be used anywhere in your Power BI solution. Furthermore, it can be filtered using attributes from your data and can also be used as a ‘feeder’ measure into other DAX measures. Here are three separate visualisations, all using the one DAX measure Total Shop Sales ex GST:
Enjoy!