If you haven’t yet used Power Query and you are pulling data into Power Pivot, you are missing out on a real gem!
I have been involved with Power Query/Pivot/View for some time now but just recently have been using Power Query extensively to pull data extracted from a corporate SAP BW system into Power Pivot and it is an absolute joy to use. So far, I have found nothing that it can’t handle in one way or another and even on very large data volumes (eg. millions of rows), it doesn’t miss a beat. Performance is excellent and will transform and load huge data volumes in a matter of minutes if not seconds.
It is also very user friendly – an essential ingredient when trying to promote self-service BI to a community of busy users reluctant to have to learn how to use “yet another system”. Any user familiar and comfortable with using Excel will have no trouble navigating and using the Power Query interface.
In my view, the data model is the key to a successful experience with Power BI (or any data warehouse!). It is worth spending some time understanding the structure of your source data and how you need to use it in order to arrive at an appropriate data model structure. Whilst spending time doing this may initially be thought of as a waste of valuable time that could better be spent actually building reports, it will pay dividends further down the line when your model supports multiple requirements and not just a one-time need.
That’s all well and good, but what does the data model have to do with Power Query? Good question. The data model lives in Power Pivot, but it is Power Query that can be used to transform your incoming data into the structure you need to build the model.
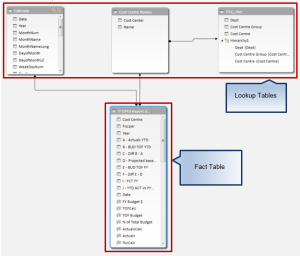
Quite often a source file will contain a lot of “fat”. For example, as well as a sales file containing relevant sales data such as product, quantity sold, price, invoice date, it might also include not only a customer number but additional attributes of the customer as well, such as customer name, address, contact details etc. These types of attributes do not belong in a fact table and should, instead, reside in a separate customer master data (or lookup) table.
The aim should be to keep your fact table as narrow as possible, containing measures (key figures in SAP BW lingo) and as little textual information as possible, which is instead held in separate lookup tables and linked to the fact table by keys (preferably numeric).
Power Query makes it exceptionally easy to pull this attribute data out of your incoming source data and into a separate lookup table, which can then be linked via keys to the fact table in Power Pivot via a one-to-many (1:n) relationship. If the incoming source file also contains other non-fact data, such as product information the same process can be used to also build a product lookup table.
This isn’t only good data modelling practice. It also substantially reduces the size of your Excel file (a customer that might exist against many lines in your sales file only exists once in the customer lookup table) and therefore also helps with overall performance.
This is all very simple stuff, but will pay huge dividends if followed and implemented correctly. The best way to get to know the capabilities of Power Query is to just use it, play with it, embrace it and love it! It really is a fantastic tool and best of all, it seems to have the focus of the Power BI brains-trust at Microsoft, with updates being rolled out every month.
So, what are you waiting for?
