Power BI Desktop, previously known as Power BI Designer, is now out and freely available for download from Microsoft.
This is not a preview release, it is a full on GA release of what promises to become an essential tool in the toolbox of many self-service BI developers and consumers alike! Microsoft saved a huge number of improvements and additions for the GA release, delivering a wonderful surprise for the multitude of preview users of Power BI Designer. The user interface, which was pretty clumsy looking and limited in functionality in preview, is now starting to look like a real contender in the market and with Redmond promising to continue with monthly updates, it is only going to continue to improve.
Add to this the seamless integration with Power BI in the cloud and all of a sudden, users have the ability to work locally and share globally, building great looking dashboards that can be set to refresh automatically.
Power BI Desktop contains all the Power tools found in Excel (Power Pivot, Power Query and Power View), although they go under different names, and by being freed from the constraints of Excel/Office, Power BI Desktop will see new features in these tools released earlier and more frequently than their equivalents in Excel.
Visualisations
Power BI Desktop comes with some additional charting options, such as: Area Charts, Waterfall Charts, Donut Charts and Matrix Tables:
Plus, there is now the ability to format colours and data labels, titles, X/Y axis, as well as add hyperlinks, text boxes, logos etc.
Data Model
On the data acquisition side, there are new data sources available in addition to the existing data sources already available:
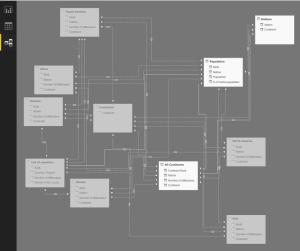
In the Power Pivot addin for Excel, there is both a data and a diagram view of the data model. Neither of these views were available in the Power BI Designer preview but Power BI Desktop delivers here as well:
OneDrive (business and personal) can be used as a source for automatic refresh of data in Power BI in the cloud. So, if you are using Excel or Power BI Designer files as a data source for example, these can be loaded into OneDrive and then a schedule can be set up in Power BI to connect to OneDrive and update automatically from there (local PC’s cannot be used for this scheduled refreshing so this offers an excellent alternative).
Conclusion
For any business professional needing to make sense of data, Power BI Desktop, together with the power of Power BI, offers a powerful yet easy-to-use approach to building reports and dashboards in a visually pleasing way that is definitely not going to break the bank!
For IT professionals bogged down with an overwhelming number of requests from business users who need delivery yesterday, this set of tools offers a fantastic self-service capability that can take the strain off your team and your business users will love it. Give them these tools and they will love you too!


